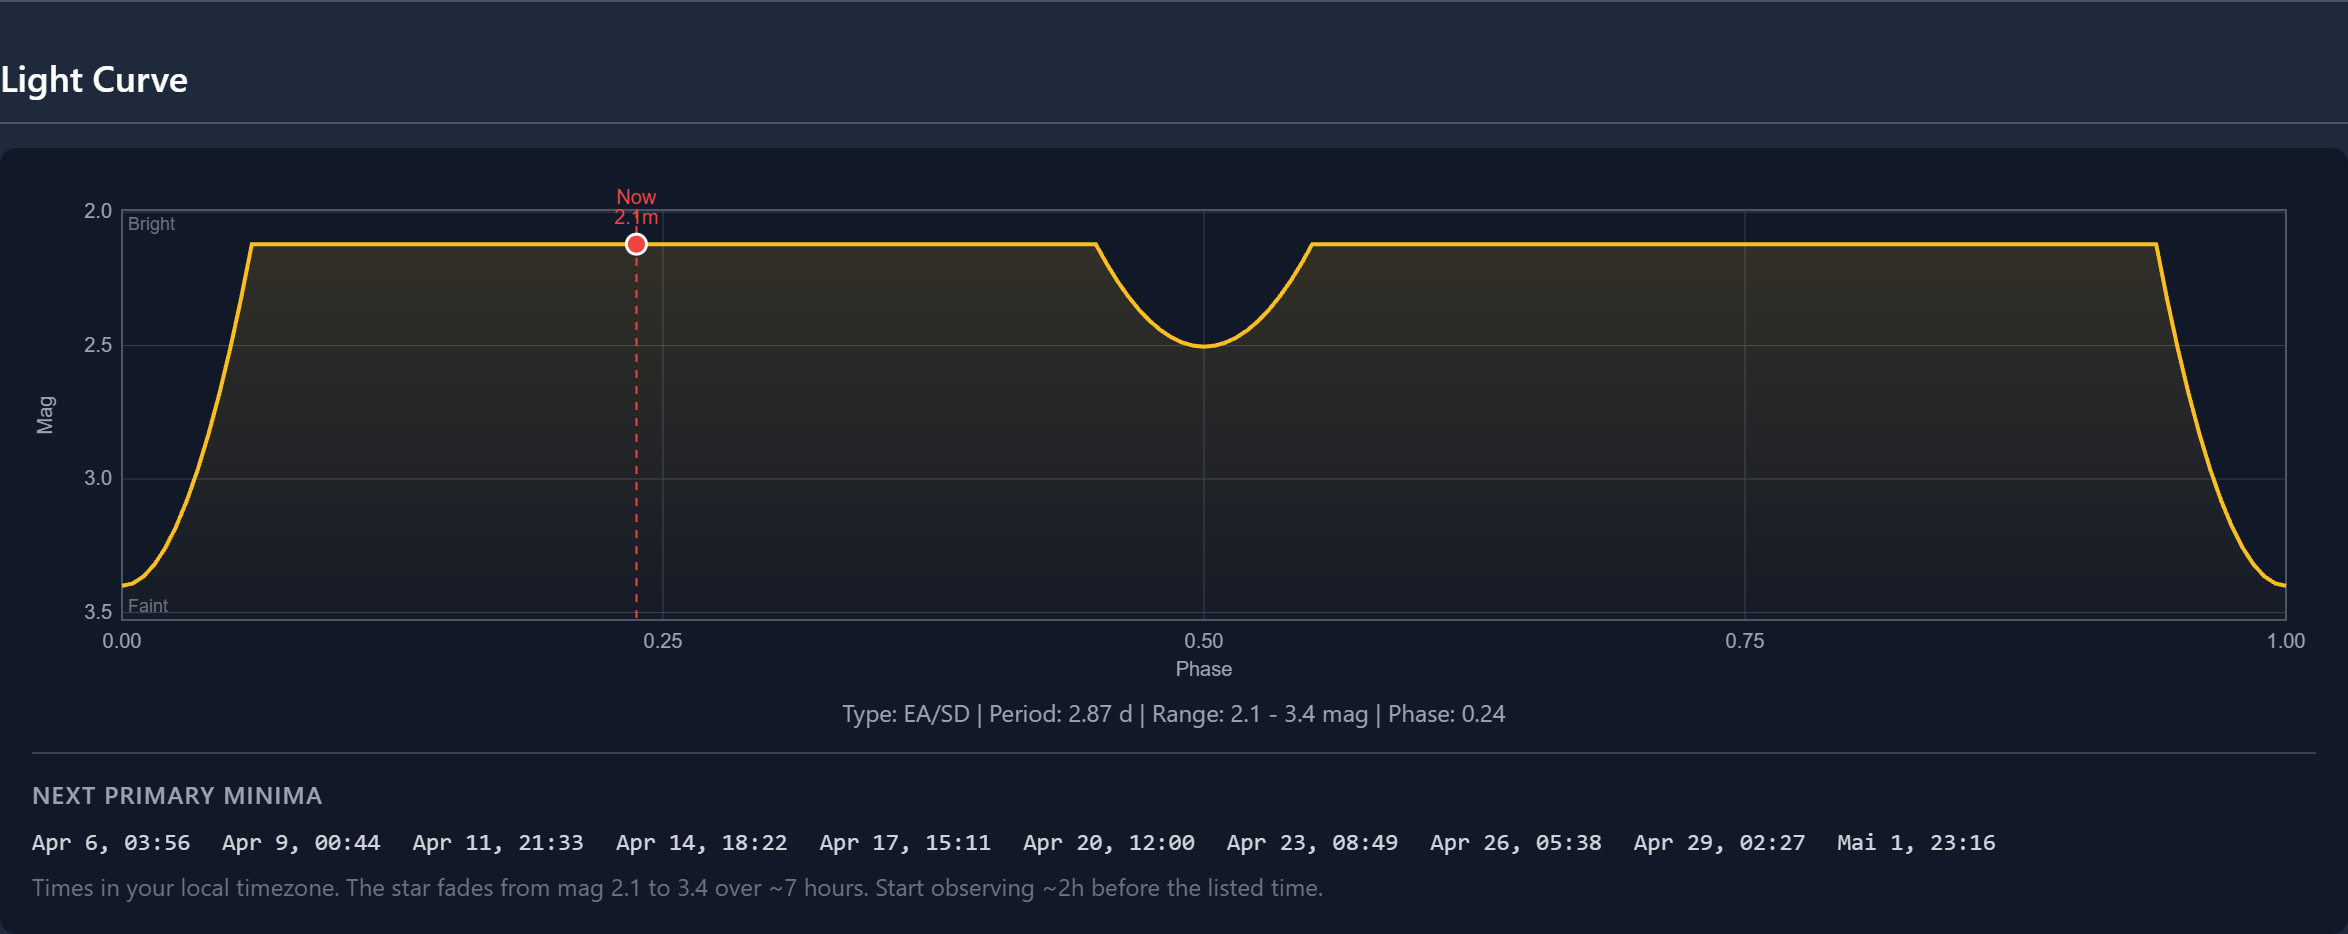
The following variable stars have well-determined periods and reference epochs, allowing Nightbase to predict when maximum or minimum brightness occurs. The light curve on each star's catalog page shows a "Now" marker indicating the current phase, so you always know whether the star is rising, falling, or near an event.
Eclipsing Binaries — Predicted Minima
Eclipsing binary periods are stable to fractions of a second, making minima predictable to within minutes even decades from the reference epoch. Nightbase predicts primary minima — the moment the fainter companion passes in front.
| Star |
Range |
Period |
Eclipse |
Notes |
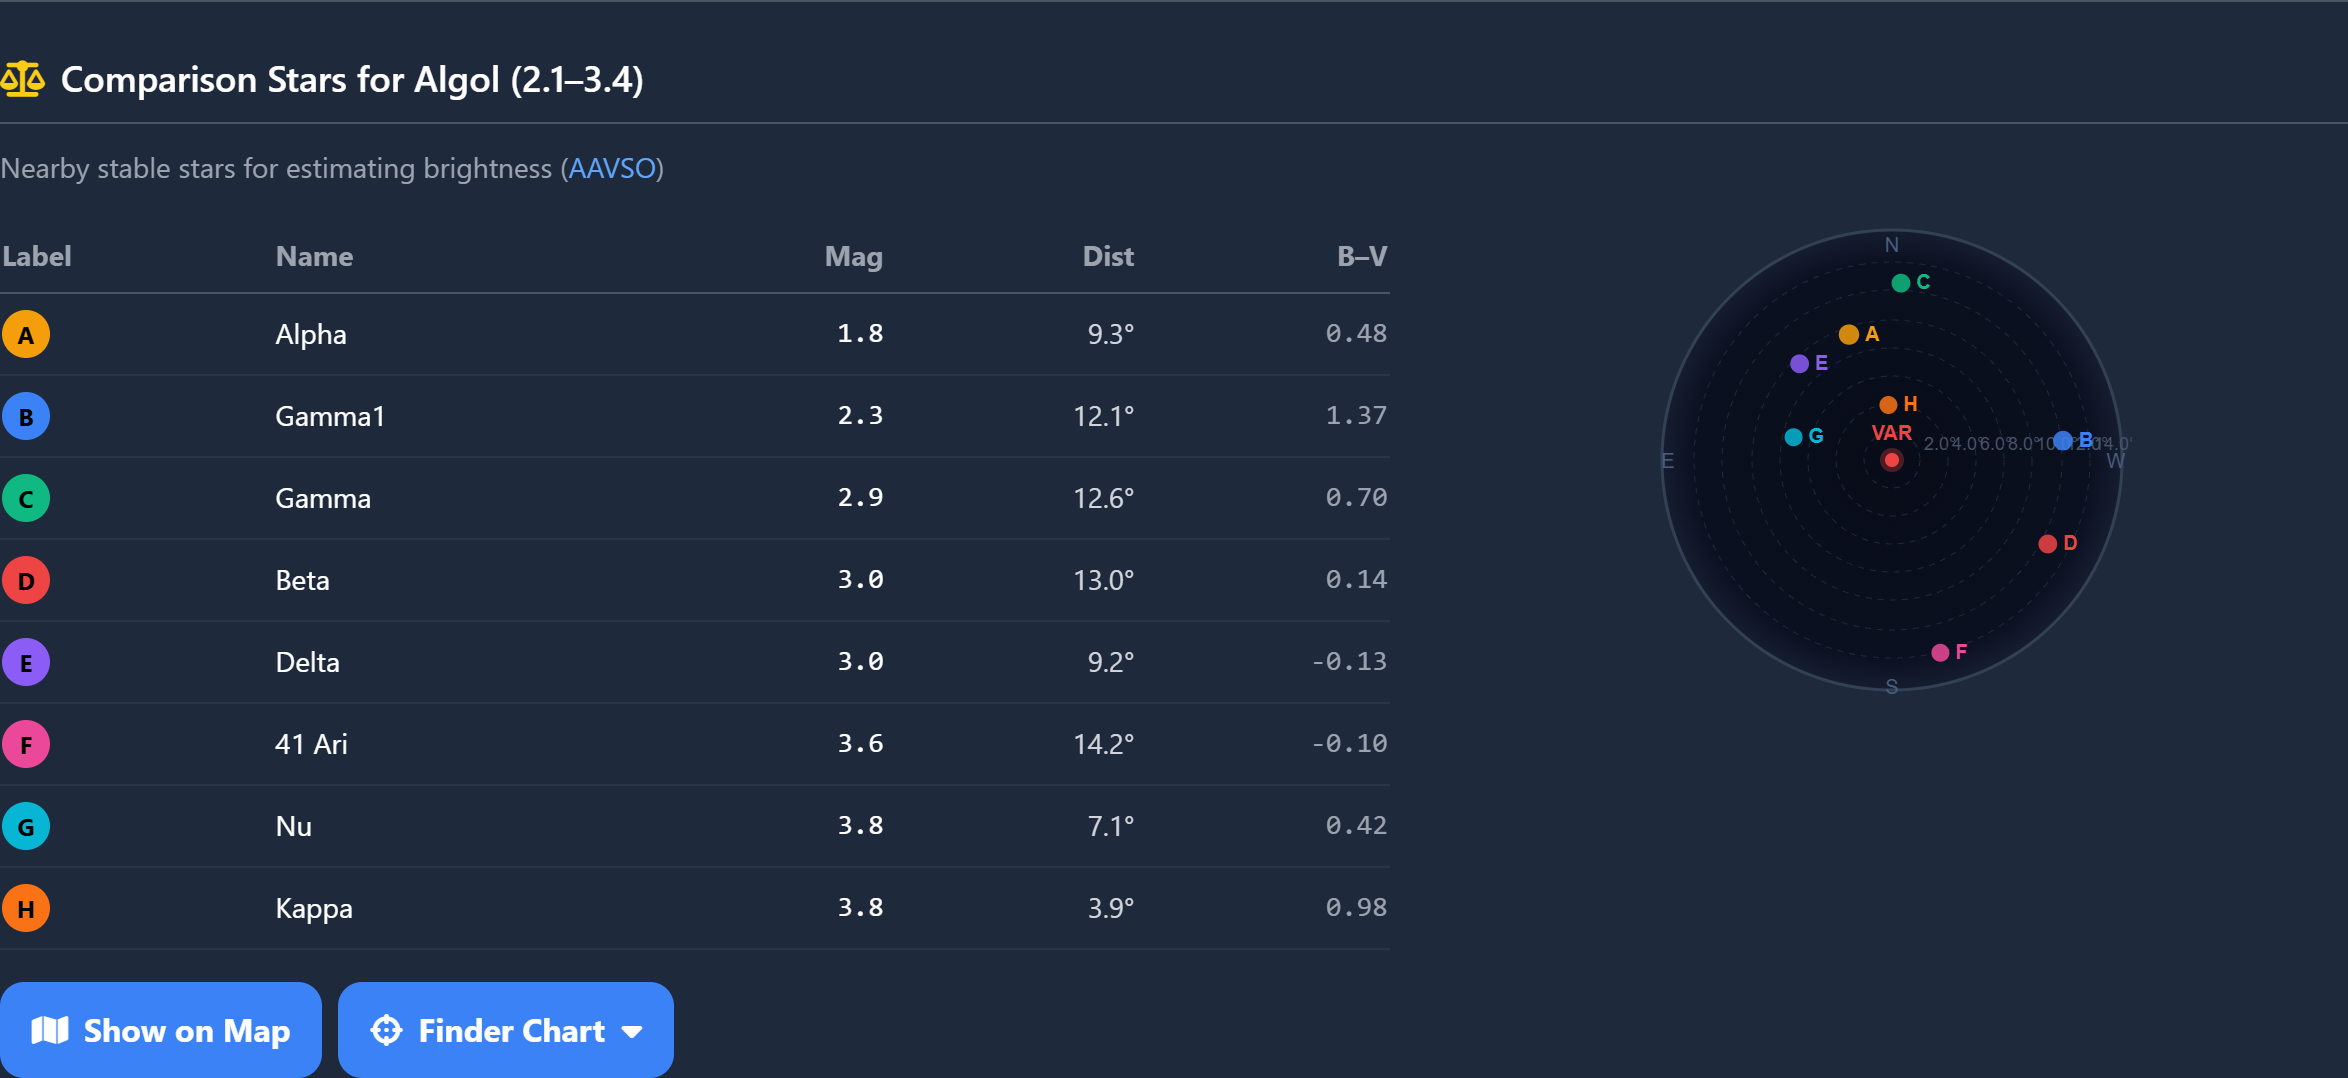
| Algol (β Per) |
2.1–3.4 |
2.87 d |
~10 h |
The classic eclipsing binary. Naked-eye drop of 1.3 mag every 2.87 days. |
| λ Tau |
3.4–3.9 |
3.95 d |
~8 h |
In the Hyades region. Abundant comparison stars nearby. |
| β Lyr (Sheliak) |
3.3–4.4 |
12.94 d |
continuous |
Never constant — two unequal minima per cycle. γ Lyrae is a built-in comparison star. |
| 68 Her |
4.7–5.4 |
2.05 d |
~6 h |
Short period gives frequent eclipses. Binoculars needed. |
| δ Lib |
4.9–5.9 |
2.33 d |
~7 h |
A full magnitude drop — dramatic in binoculars. |
| R CMa |
5.7–6.3 |
1.14 d |
~4 h |
Fastest period in this list. Multiple eclipses per week. |
| ζ Phe |
3.9–4.4 |
1.67 d |
~5 h |
Southern sky eclipsing binary. Dec −55°. |
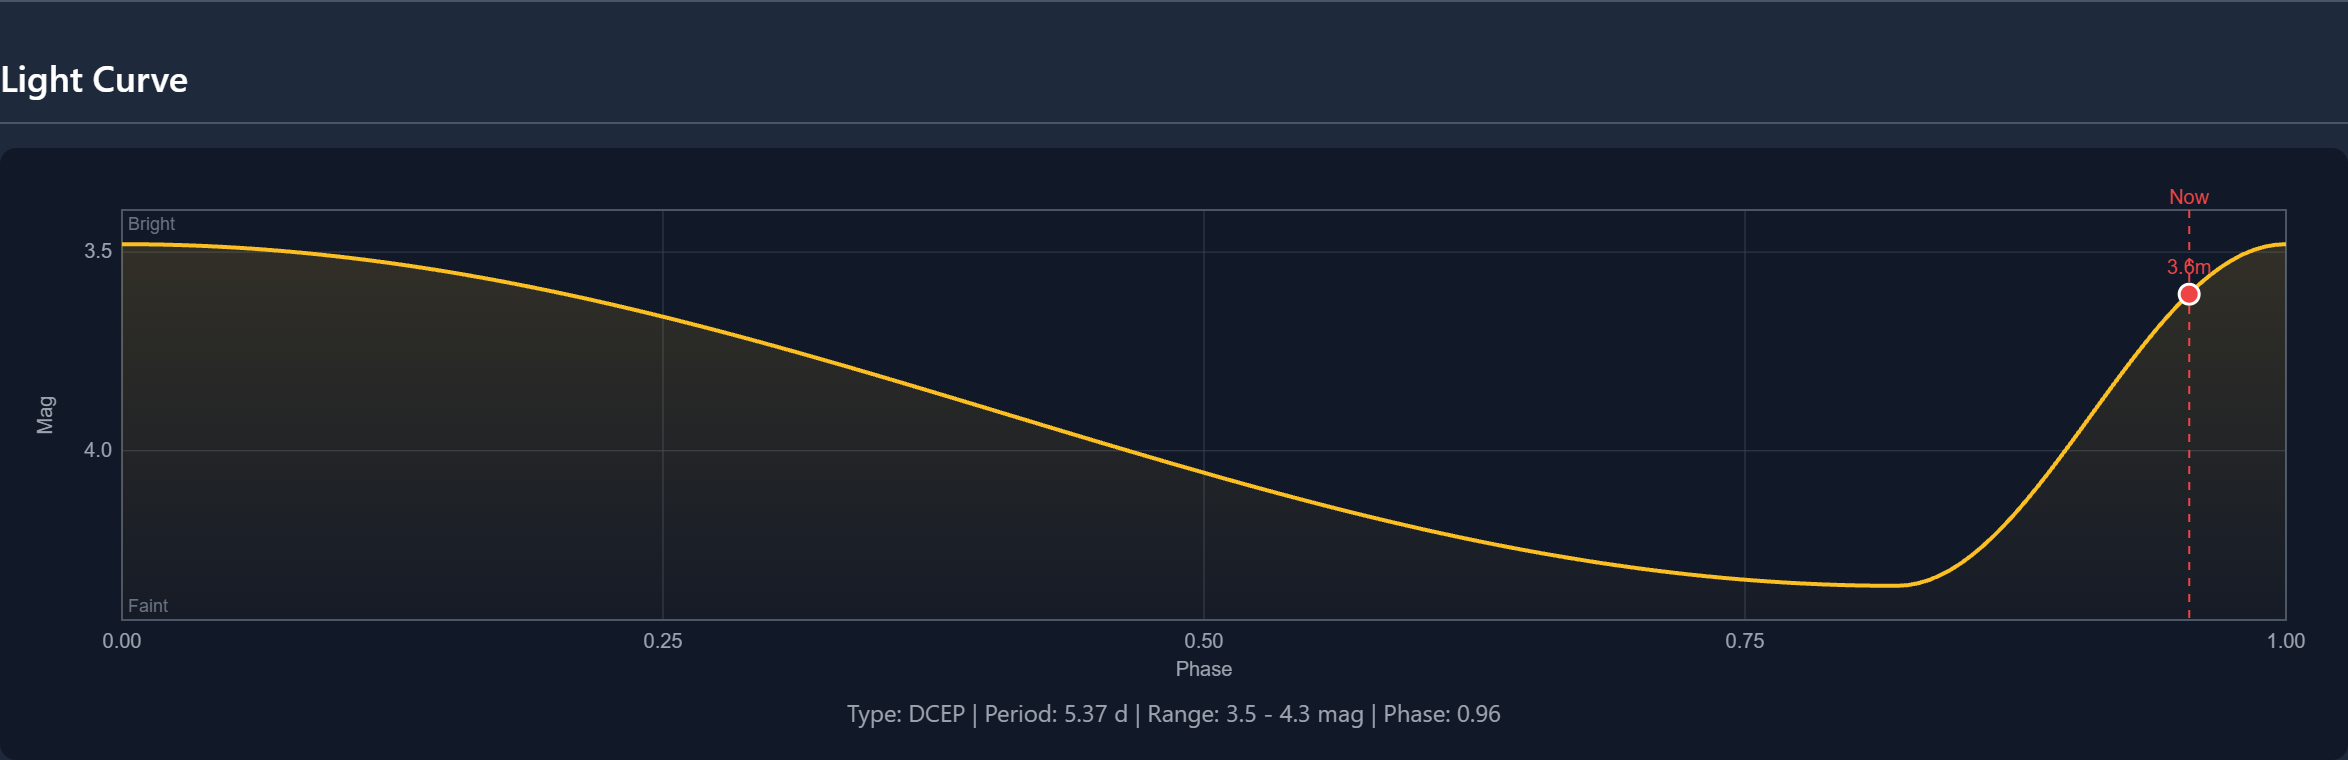
Cepheids — Predicted Maxima
Cepheids pulsate with clock-like precision. The epoch marks maximum brightness, followed by a slow decline and rapid rise. Nightbase predicts when each maximum occurs.
| Star |
Range |
Period |
Notes |
| δ Cep |
3.5–4.4 |
5.37 d |
The prototype Cepheid. Circumpolar from mid-northern latitudes. |
| η Aql |
3.5–4.3 |
7.18 d |
Summer Cepheid near Altair. One of the first variables ever identified (1784). |
| ζ Gem (Mekbuda) |
3.6–4.2 |
10.15 d |
Slow, steady rhythm — ideal for beginners learning magnitude estimation. |
| FF Aql |
5.2–5.7 |
4.47 d |
Binocular Cepheid in Aquila. Small amplitude but fast cycle. |
| T Vul |
5.4–6.1 |
4.44 d |
In Vulpecula near the Dumbbell Nebula. Good binocular target. |
| X Cyg |
5.9–6.9 |
16.39 d |
Over 1 magnitude amplitude — the most dramatic binocular Cepheid in the north. |
RR Lyrae — Full Cycle in One Night
RR Lyrae pulsates so rapidly that you can watch an entire max–min–max cycle in a single observing session.
| Star |
Range |
Period |
Notes |
| RR Lyr |
7.1–8.1 |
13.6 h |
The prototype — between Vega and Sulafat. A full 1-magnitude cycle completes in under 14 hours, with a fast rise (~2 h) and slow decline (~11 h). Binoculars or small telescope needed. |
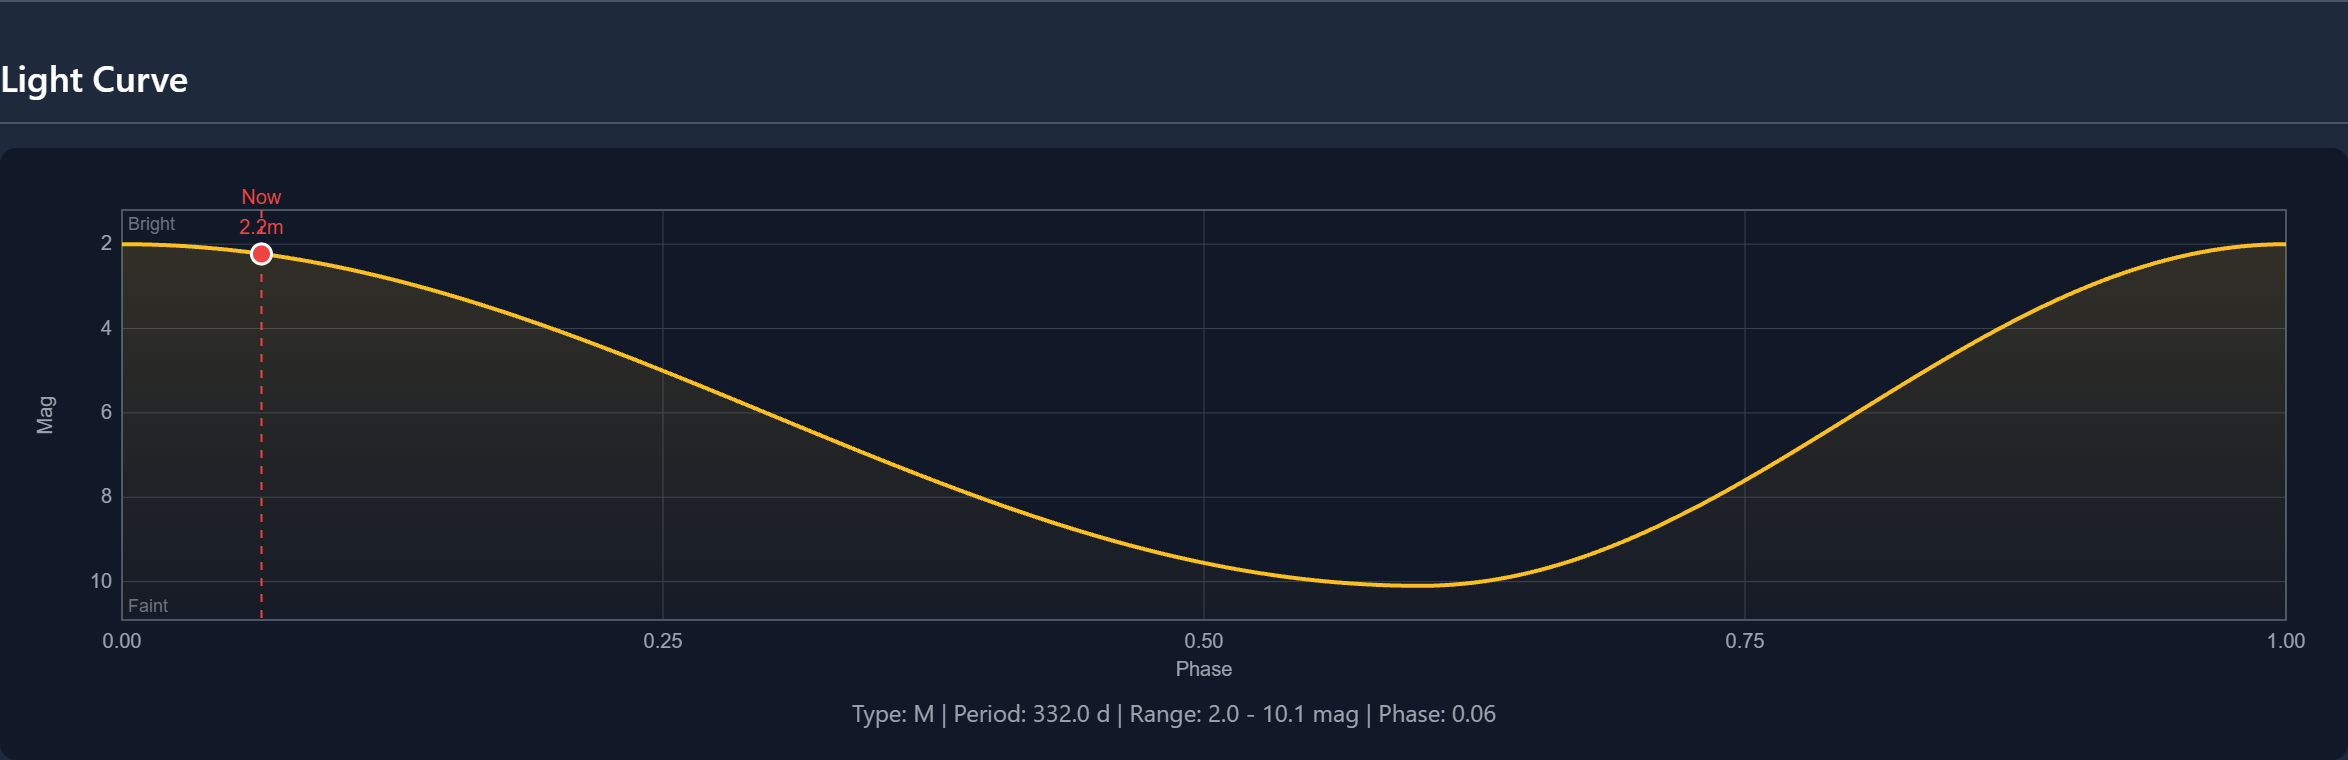
Mira Variables — Approximate Maxima
Mira-type variables have periods of hundreds of days and enormous amplitude, but their maxima can shift by 2–4 weeks from the predicted date. Use the phase to know roughly when to start looking, then observe regularly as the predicted maximum approaches.
| Star |
Range |
Period |
Notes |
| Mira (o Cet) |
2.0–10.1 |
332 d |
At maximum naked-eye bright; disappears entirely in binoculars at minimum. |
| χ Cyg |
3.3–14.2 |
408 d |
Nearly 11 magnitudes of range — from naked eye to 6-inch telescope territory. |
| R Leo |
4.4–11.3 |
312 d |
Near Regulus — easy to find. Beautiful deep red colour. |
| R Hya |
3.5–10.9 |
359 d |
Bright at maximum. One of the first Miras discovered (1704). |
| R Cas |
4.7–13.5 |
430 d |
In Cassiopeia — circumpolar and observable year-round from northern latitudes. |
| T Cep |
5.2–11.3 |
389 d |
Circumpolar Mira in Cepheus. 6 magnitudes of range. |
| R And |
5.8–14.9 |
409 d |
Over 9 magnitudes amplitude. A good telescope challenge at minimum. |
Other Predictable Variables
| Star |
Type |
Range |
Period |
Notes |
| R Sct |
RV Tau |
4.5–8.2 |
144 d |
Alternating deep and shallow minima. The brightest RV Tauri star. |
| κ Pav |
W Vir |
3.9–4.8 |
9.08 d |
Brightest Type II Cepheid. Southern sky (Dec −67°). |
In Nightbase
Open any of these stars in the catalog to see a live light curve with the current phase marked. For eclipsing binaries, the Tonight page shows upcoming minima visible from your location.